Advanced Search: Build a Custom Dashboard
In the fields below, search for indicators by location, topics, population, classification, subgroup, or comparison. No fields are required, but we suggest selecting a location or two to start. In the additional search options section, select options to group and order search results. To learn more about how to customize a dashboard, see our help center.
Visit the Indicator List Page to see the full list of indicators and locations available on the site.
Search Results:
Indicator Gauge Icon Legend
Legend Colors
Red is bad, green is good, blue is not statistically different/neutral.
Compared to Distribution
 the value is in the best half of communities.
 the value is in the 2nd worst quarter of communities.
 the value is in the worst quarter of communities.
Compared to Target
 meets target;
  does not meet target.
Compared to a Single Value
 lower than the comparison value;
 higher than the comparison value;
 not statistically different from comparison value.
Trend

 non-significant change over time;
 significant change over time;
  no change over time.
Compared to Prior Value
 higher than the previous measurement period;
 lower than the previous measurement period;
 no statistically different change from previous measurement period.
Health / Alcohol & Drug Use
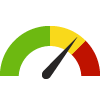
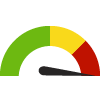
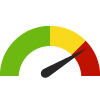
Adults who Binge Drink County: Abbeville
Adults who Binge Drink County: Abbeville
14.5%
(2021)
Compared to:
SC Counties
The distribution is based on data from 46 South Carolina counties.
U.S. Counties
The distribution is based on data from 3,074 U.S. counties and county equivalents.
US Value
(15.5%)
The regional value is compared to the national value.
Adults who Binge Drink County: Greenwood
Adults who Binge Drink County: Greenwood
13.6%
(2021)
Compared to:
SC Counties
The distribution is based on data from 46 South Carolina counties.
U.S. Counties
The distribution is based on data from 3,074 U.S. counties and county equivalents.
US Value
(15.5%)
The regional value is compared to the national value.
Adults who Binge Drink County: McCormick
Adults who Binge Drink County: McCormick
12.3%
(2021)
Compared to:
SC Counties
The distribution is based on data from 46 South Carolina counties.
U.S. Counties
The distribution is based on data from 3,074 U.S. counties and county equivalents.
US Value
(15.5%)
The regional value is compared to the national value.
Adults who Binge Drink County: Saluda
Adults who Binge Drink County: Saluda
14.3%
(2021)
Compared to:
SC Counties
The distribution is based on data from 46 South Carolina counties.
U.S. Counties
The distribution is based on data from 3,074 U.S. counties and county equivalents.
US Value
(15.5%)
The regional value is compared to the national value.
Adults who Binge Drink Census Place: Abbeville
Adults who Binge Drink Census Place: Abbeville
14.1%
(2021)
Compared to:
SC Census Places
The distribution is based on data from 394 locales.
U.S. Census Places
The distribution is based on data from 27,528 U.S. Census Places.
Abbeville, SC County Value
(14.5%)
The regional value is compared to the Abbeville County value.
US Value
(15.5%)
The regional value is compared to the national value.
Adults who Binge Drink Census Place: Antreville
Adults who Binge Drink Census Place: Antreville
14.1%
(2021)
Compared to:
SC Census Places
The distribution is based on data from 394 locales.
U.S. Census Places
The distribution is based on data from 27,528 U.S. Census Places.
Abbeville, SC County Value
(14.5%)
The regional value is compared to the Abbeville County value.
US Value
(15.5%)
The regional value is compared to the national value.
Adults who Binge Drink Census Place: Batesburg-Leesville
Adults who Binge Drink Census Place: Batesburg-Leesville
13.9%
(2021)
Compared to:
SC Census Places
The distribution is based on data from 394 locales.
U.S. Census Places
The distribution is based on data from 27,528 U.S. Census Places.
Saluda, SC County Value
(14.3%)
The regional value is compared to the Saluda County value.
US Value
(15.5%)
The regional value is compared to the national value.
Adults who Binge Drink Census Place: Bradley
Adults who Binge Drink Census Place: Bradley
13.7%
(2021)
Compared to:

SC Census Places
The distribution is based on data from 394 locales.
U.S. Census Places
The distribution is based on data from 27,528 U.S. Census Places.
Greenwood, SC County Value
(13.6%)
The regional value is compared to the Greenwood County value.
US Value
(15.5%)
The regional value is compared to the national value.
Adults who Binge Drink Census Place: Calhoun Falls
Adults who Binge Drink Census Place: Calhoun Falls
13.8%
(2021)
Compared to:
SC Census Places
The distribution is based on data from 394 locales.
U.S. Census Places
The distribution is based on data from 27,528 U.S. Census Places.
Abbeville, SC County Value
(14.5%)
The regional value is compared to the Abbeville County value.
US Value
(15.5%)
The regional value is compared to the national value.
Adults who Binge Drink Census Place: Clarks Hill
Adults who Binge Drink Census Place: Clarks Hill
13.2%
(2021)
Compared to:
SC Census Places
The distribution is based on data from 394 locales.
U.S. Census Places
The distribution is based on data from 27,528 U.S. Census Places.
McCormick, SC County Value
(12.3%)
The regional value is compared to the McCormick County value.
US Value
(15.5%)
The regional value is compared to the national value.
Adults who Binge Drink Census Place: Cokesbury
Adults who Binge Drink Census Place: Cokesbury
13.2%
(2021)
Compared to:
SC Census Places
The distribution is based on data from 394 locales.
U.S. Census Places
The distribution is based on data from 27,528 U.S. Census Places.
Greenwood, SC County Value
(13.6%)
The regional value is compared to the Greenwood County value.
US Value
(15.5%)
The regional value is compared to the national value.
Adults who Binge Drink Census Place: Coronaca
Adults who Binge Drink Census Place: Coronaca
15.5%
(2021)
Compared to:
SC Census Places
The distribution is based on data from 394 locales.
U.S. Census Places
The distribution is based on data from 27,528 U.S. Census Places.
Greenwood, SC County Value
(13.6%)
The regional value is compared to the Greenwood County value.
US Value
(15.5%)
The regional value is compared to the national value.
Adults who Binge Drink Census Place: Donalds
Adults who Binge Drink Census Place: Donalds
16.3%
(2021)
Compared to:
SC Census Places
The distribution is based on data from 394 locales.
U.S. Census Places
The distribution is based on data from 27,528 U.S. Census Places.
Abbeville, SC County Value
(14.5%)
The regional value is compared to the Abbeville County value.
US Value
(15.5%)
The regional value is compared to the national value.
Adults who Binge Drink Census Place: Due West
Adults who Binge Drink Census Place: Due West
18.8%
(2021)
Compared to:
SC Census Places
The distribution is based on data from 394 locales.
U.S. Census Places
The distribution is based on data from 27,528 U.S. Census Places.
Abbeville, SC County Value
(14.5%)
The regional value is compared to the Abbeville County value.
US Value
(15.5%)
The regional value is compared to the national value.
Adults who Binge Drink Census Place: Greenwood
Adults who Binge Drink Census Place: Greenwood
14.1%
(2021)
Compared to:
SC Census Places
The distribution is based on data from 394 locales.
U.S. Census Places
The distribution is based on data from 27,528 U.S. Census Places.
Greenwood, SC County Value
(13.6%)
The regional value is compared to the Greenwood County value.
US Value
(15.5%)
The regional value is compared to the national value.
Adults who Binge Drink Census Place: Hodges
Adults who Binge Drink Census Place: Hodges
14.8%
(2021)
Compared to:
SC Census Places
The distribution is based on data from 394 locales.
U.S. Census Places
The distribution is based on data from 27,528 U.S. Census Places.
Greenwood, SC County Value
(13.6%)
The regional value is compared to the Greenwood County value.
US Value
(15.5%)
The regional value is compared to the national value.
Adults who Binge Drink Census Place: Honea Path
Adults who Binge Drink Census Place: Honea Path
15.2%
(2021)
Compared to:
SC Census Places
The distribution is based on data from 394 locales.
U.S. Census Places
The distribution is based on data from 27,528 U.S. Census Places.
Abbeville, SC County Value
(14.5%)
The regional value is compared to the Abbeville County value.
US Value
(15.5%)
The regional value is compared to the national value.
Adults who Binge Drink Census Place: Lake Secession
Adults who Binge Drink Census Place: Lake Secession
14.2%
(2021)
Compared to:
SC Census Places
The distribution is based on data from 394 locales.
U.S. Census Places
The distribution is based on data from 27,528 U.S. Census Places.
Abbeville, SC County Value
(14.5%)
The regional value is compared to the Abbeville County value.
US Value
(15.5%)
The regional value is compared to the national value.
Adults who Binge Drink Census Place: Lowndesville
Adults who Binge Drink Census Place: Lowndesville
14.3%
(2021)
Compared to:
SC Census Places
The distribution is based on data from 394 locales.
U.S. Census Places
The distribution is based on data from 27,528 U.S. Census Places.
Abbeville, SC County Value
(14.5%)
The regional value is compared to the Abbeville County value.
US Value
(15.5%)
The regional value is compared to the national value.
Adults who Binge Drink Census Place: McCormick
Adults who Binge Drink Census Place: McCormick
17.1%
(2021)
Compared to:
SC Census Places
The distribution is based on data from 394 locales.
U.S. Census Places
The distribution is based on data from 27,528 U.S. Census Places.
McCormick, SC County Value
(12.3%)
The regional value is compared to the McCormick County value.
US Value
(15.5%)
The regional value is compared to the national value.
Adults who Binge Drink Census Place: Modoc
Adults who Binge Drink Census Place: Modoc
14.4%
(2021)
Compared to:
SC Census Places
The distribution is based on data from 394 locales.
U.S. Census Places
The distribution is based on data from 27,528 U.S. Census Places.
McCormick, SC County Value
(12.3%)
The regional value is compared to the McCormick County value.
US Value
(15.5%)
The regional value is compared to the national value.
Adults who Binge Drink Census Place: Monetta
Adults who Binge Drink Census Place: Monetta
14.3%
(2021)
Compared to:
SC Census Places
The distribution is based on data from 394 locales.
U.S. Census Places
The distribution is based on data from 27,528 U.S. Census Places.
Saluda, SC County Value
(14.3%)
The regional value is compared to the Saluda County value.
US Value
(15.5%)
The regional value is compared to the national value.
Adults who Binge Drink Census Place: Mount Carmel
Adults who Binge Drink Census Place: Mount Carmel
12.2%
(2021)
Compared to:
SC Census Places
The distribution is based on data from 394 locales.
U.S. Census Places
The distribution is based on data from 27,528 U.S. Census Places.
McCormick, SC County Value
(12.3%)
The regional value is compared to the McCormick County value.
US Value
(15.5%)
The regional value is compared to the national value.
Adults who Binge Drink Census Place: Ninety Six
Adults who Binge Drink Census Place: Ninety Six
13.7%
(2021)
Compared to:
SC Census Places
The distribution is based on data from 394 locales.
U.S. Census Places
The distribution is based on data from 27,528 U.S. Census Places.
Greenwood, SC County Value
(13.6%)
The regional value is compared to the Greenwood County value.
US Value
(15.5%)
The regional value is compared to the national value.
Adults who Binge Drink Census Place: Parksville
Adults who Binge Drink Census Place: Parksville
15.4%
(2021)
Compared to:
SC Census Places
The distribution is based on data from 394 locales.
U.S. Census Places
The distribution is based on data from 27,528 U.S. Census Places.
McCormick, SC County Value
(12.3%)
The regional value is compared to the McCormick County value.
US Value
(15.5%)
The regional value is compared to the national value.
Adults who Binge Drink Census Place: Plum Branch
Adults who Binge Drink Census Place: Plum Branch
15.0%
(2021)
Compared to:
SC Census Places
The distribution is based on data from 394 locales.
U.S. Census Places
The distribution is based on data from 27,528 U.S. Census Places.
McCormick, SC County Value
(12.3%)
The regional value is compared to the McCormick County value.
US Value
(15.5%)
The regional value is compared to the national value.
Adults who Binge Drink Census Place: Promised Land
Adults who Binge Drink Census Place: Promised Land
10.6%
(2021)
Compared to:
SC Census Places
The distribution is based on data from 394 locales.
U.S. Census Places
The distribution is based on data from 27,528 U.S. Census Places.
Greenwood, SC County Value
(13.6%)
The regional value is compared to the Greenwood County value.
US Value
(15.5%)
The regional value is compared to the national value.
Adults who Binge Drink Census Place: Ridge Spring
Adults who Binge Drink Census Place: Ridge Spring
12.9%
(2021)
Compared to:
SC Census Places
The distribution is based on data from 394 locales.
U.S. Census Places
The distribution is based on data from 27,528 U.S. Census Places.
Saluda, SC County Value
(14.3%)
The regional value is compared to the Saluda County value.
US Value
(15.5%)
The regional value is compared to the national value.
Adults who Binge Drink Census Place: Saluda
Adults who Binge Drink Census Place: Saluda
15.8%
(2021)
Compared to:
SC Census Places
The distribution is based on data from 394 locales.
U.S. Census Places
The distribution is based on data from 27,528 U.S. Census Places.
Saluda, SC County Value
(14.3%)
The regional value is compared to the Saluda County value.
US Value
(15.5%)
The regional value is compared to the national value.
Adults who Binge Drink Census Place: Troy
Adults who Binge Drink Census Place: Troy
12.6%
(2021)
Compared to:
SC Census Places
The distribution is based on data from 394 locales.
U.S. Census Places
The distribution is based on data from 27,528 U.S. Census Places.
Greenwood, SC County Value
(13.6%)
The regional value is compared to the Greenwood County value.
US Value
(15.5%)
The regional value is compared to the national value.
Adults who Binge Drink Census Place: Ward
Adults who Binge Drink Census Place: Ward
16.6%
(2021)
Compared to:
SC Census Places
The distribution is based on data from 394 locales.
U.S. Census Places
The distribution is based on data from 27,528 U.S. Census Places.
Saluda, SC County Value
(14.3%)
The regional value is compared to the Saluda County value.
US Value
(15.5%)
The regional value is compared to the national value.
Adults who Binge Drink Census Place: Ware Shoals
Adults who Binge Drink Census Place: Ware Shoals
14.4%
(2021)
Compared to:
SC Census Places
The distribution is based on data from 394 locales.
U.S. Census Places
The distribution is based on data from 27,528 U.S. Census Places.
Greenwood, SC County Value
(13.6%)
The regional value is compared to the Greenwood County value.
Abbeville, SC County Value
(14.5%)
The regional value is compared to the Abbeville County value.
US Value
(15.5%)
The regional value is compared to the national value.
Adults who Binge Drink Census Place: Willington
Adults who Binge Drink Census Place: Willington
13.5%
(2021)
Compared to:
SC Census Places
The distribution is based on data from 394 locales.
U.S. Census Places
The distribution is based on data from 27,528 U.S. Census Places.
McCormick, SC County Value
(12.3%)
The regional value is compared to the McCormick County value.
US Value
(15.5%)
The regional value is compared to the national value.
Adults who Binge Drink Zip Code: 29129
Adults who Binge Drink Zip Code: 29129
15.1%
(2021)
Compared to:
SC Zip Codes
The distribution is based on data from 421 South Carolina zip codes.
U.S. Zip Codes
The distribution is based on data from 31,435 U.S. zip codes.
Saluda, SC County Value
(14.3%)
The regional value is compared to the Saluda County value.
US Value
(15.5%)
The regional value is compared to the national value.
Adults who Binge Drink Zip Code: 29138
Adults who Binge Drink Zip Code: 29138
15.4%
(2021)
Compared to:
SC Zip Codes
The distribution is based on data from 421 South Carolina zip codes.
U.S. Zip Codes
The distribution is based on data from 31,435 U.S. zip codes.
Saluda, SC County Value
(14.3%)
The regional value is compared to the Saluda County value.
US Value
(15.5%)
The regional value is compared to the national value.
Adults who Binge Drink Zip Code: 29166
Adults who Binge Drink Zip Code: 29166
15.8%
(2021)
Compared to:
SC Zip Codes
The distribution is based on data from 421 South Carolina zip codes.
U.S. Zip Codes
The distribution is based on data from 31,435 U.S. zip codes.
Saluda, SC County Value
(14.3%)
The regional value is compared to the Saluda County value.
US Value
(15.5%)
The regional value is compared to the national value.
Adults who Binge Drink Zip Code: 29620
Adults who Binge Drink Zip Code: 29620
15.0%
(2021)
Compared to:
SC Zip Codes
The distribution is based on data from 421 South Carolina zip codes.
U.S. Zip Codes
The distribution is based on data from 31,435 U.S. zip codes.
Abbeville, SC County Value
(14.5%)
The regional value is compared to the Abbeville County value.
US Value
(15.5%)
The regional value is compared to the national value.
Adults who Binge Drink Zip Code: 29628
Adults who Binge Drink Zip Code: 29628
13.6%
(2021)
Compared to:
SC Zip Codes
The distribution is based on data from 421 South Carolina zip codes.
U.S. Zip Codes
The distribution is based on data from 31,435 U.S. zip codes.
Abbeville, SC County Value
(14.5%)
The regional value is compared to the Abbeville County value.
US Value
(15.5%)
The regional value is compared to the national value.
Adults who Binge Drink Zip Code: 29638
Adults who Binge Drink Zip Code: 29638
15.8%
(2021)
Compared to:
SC Zip Codes
The distribution is based on data from 421 South Carolina zip codes.
U.S. Zip Codes
The distribution is based on data from 31,435 U.S. zip codes.
Abbeville, SC County Value
(14.5%)
The regional value is compared to the Abbeville County value.
US Value
(15.5%)
The regional value is compared to the national value.
Adults who Binge Drink Zip Code: 29639
Adults who Binge Drink Zip Code: 29639
17.9%
(2021)
Compared to:
SC Zip Codes
The distribution is based on data from 421 South Carolina zip codes.
U.S. Zip Codes
The distribution is based on data from 31,435 U.S. zip codes.
Abbeville, SC County Value
(14.5%)
The regional value is compared to the Abbeville County value.
US Value
(15.5%)
The regional value is compared to the national value.
Adults who Binge Drink Zip Code: 29646
Adults who Binge Drink Zip Code: 29646
13.2%
(2021)
Compared to:
SC Zip Codes
The distribution is based on data from 421 South Carolina zip codes.
U.S. Zip Codes
The distribution is based on data from 31,435 U.S. zip codes.
Greenwood, SC County Value
(13.6%)
The regional value is compared to the Greenwood County value.
US Value
(15.5%)
The regional value is compared to the national value.
Adults who Binge Drink Zip Code: 29649
Adults who Binge Drink Zip Code: 29649
15.6%
(2021)
Compared to:
SC Zip Codes
The distribution is based on data from 421 South Carolina zip codes.
U.S. Zip Codes
The distribution is based on data from 31,435 U.S. zip codes.
Greenwood, SC County Value
(13.6%)
The regional value is compared to the Greenwood County value.
US Value
(15.5%)
The regional value is compared to the national value.
Adults who Binge Drink Zip Code: 29653
Adults who Binge Drink Zip Code: 29653
14.7%
(2021)
Compared to:
SC Zip Codes
The distribution is based on data from 421 South Carolina zip codes.
U.S. Zip Codes
The distribution is based on data from 31,435 U.S. zip codes.
Greenwood, SC County Value
(13.6%)
The regional value is compared to the Greenwood County value.
US Value
(15.5%)
The regional value is compared to the national value.
Adults who Binge Drink Zip Code: 29659
Adults who Binge Drink Zip Code: 29659
14.3%
(2021)
Compared to:
SC Zip Codes
The distribution is based on data from 421 South Carolina zip codes.
U.S. Zip Codes
The distribution is based on data from 31,435 U.S. zip codes.
Abbeville, SC County Value
(14.5%)
The regional value is compared to the Abbeville County value.
US Value
(15.5%)
The regional value is compared to the national value.
Adults who Binge Drink Zip Code: 29666
Adults who Binge Drink Zip Code: 29666
14.0%
(2021)
Compared to:
SC Zip Codes
The distribution is based on data from 421 South Carolina zip codes.
U.S. Zip Codes
The distribution is based on data from 31,435 U.S. zip codes.
Greenwood, SC County Value
(13.6%)
The regional value is compared to the Greenwood County value.
US Value
(15.5%)
The regional value is compared to the national value.
Adults who Binge Drink Zip Code: 29819
Adults who Binge Drink Zip Code: 29819
13.9%
(2021)
Compared to:
SC Zip Codes
The distribution is based on data from 421 South Carolina zip codes.
U.S. Zip Codes
The distribution is based on data from 31,435 U.S. zip codes.
Greenwood, SC County Value
(13.6%)
The regional value is compared to the Greenwood County value.
US Value
(15.5%)
The regional value is compared to the national value.
Adults who Binge Drink Zip Code: 29821
Adults who Binge Drink Zip Code: 29821
15.9%
(2021)
Compared to:
SC Zip Codes
The distribution is based on data from 421 South Carolina zip codes.
U.S. Zip Codes
The distribution is based on data from 31,435 U.S. zip codes.
McCormick, SC County Value
(12.3%)
The regional value is compared to the McCormick County value.
US Value
(15.5%)
The regional value is compared to the national value.
Adults who Binge Drink Zip Code: 29835
Adults who Binge Drink Zip Code: 29835
11.5%
(2021)
Compared to:
SC Zip Codes
The distribution is based on data from 421 South Carolina zip codes.
U.S. Zip Codes
The distribution is based on data from 31,435 U.S. zip codes.
McCormick, SC County Value
(12.3%)
The regional value is compared to the McCormick County value.
US Value
(15.5%)
The regional value is compared to the national value.
Adults who Binge Drink Zip Code: 29838
Adults who Binge Drink Zip Code: 29838
15.0%
(2021)
Compared to:
SC Zip Codes
The distribution is based on data from 421 South Carolina zip codes.
U.S. Zip Codes
The distribution is based on data from 31,435 U.S. zip codes.
McCormick, SC County Value
(12.3%)
The regional value is compared to the McCormick County value.
US Value
(15.5%)
The regional value is compared to the national value.
Adults who Binge Drink Zip Code: 29840
Adults who Binge Drink Zip Code: 29840
12.3%
(2021)
Compared to:
SC Zip Codes
The distribution is based on data from 421 South Carolina zip codes.
U.S. Zip Codes
The distribution is based on data from 31,435 U.S. zip codes.
McCormick, SC County Value
(12.3%)
The regional value is compared to the McCormick County value.
US Value
(15.5%)
The regional value is compared to the national value.
Adults who Binge Drink Zip Code: 29844
Adults who Binge Drink Zip Code: 29844
14.4%
(2021)
Compared to:
SC Zip Codes
The distribution is based on data from 421 South Carolina zip codes.
U.S. Zip Codes
The distribution is based on data from 31,435 U.S. zip codes.
McCormick, SC County Value
(12.3%)
The regional value is compared to the McCormick County value.
US Value
(15.5%)
The regional value is compared to the national value.
Adults who Binge Drink Zip Code: 29845
Adults who Binge Drink Zip Code: 29845
13.1%
(2021)
Compared to:
SC Zip Codes
The distribution is based on data from 421 South Carolina zip codes.
U.S. Zip Codes
The distribution is based on data from 31,435 U.S. zip codes.
McCormick, SC County Value
(12.3%)
The regional value is compared to the McCormick County value.
US Value
(15.5%)
The regional value is compared to the national value.
Adults who Binge Drink Zip Code: 29848
Adults who Binge Drink Zip Code: 29848
13.7%
(2021)
Compared to:
SC Zip Codes
The distribution is based on data from 421 South Carolina zip codes.
U.S. Zip Codes
The distribution is based on data from 31,435 U.S. zip codes.
Greenwood, SC County Value
(13.6%)
The regional value is compared to the Greenwood County value.
US Value
(15.5%)
The regional value is compared to the national value.
Adults who Binge Drink Zip Code: 29899
Adults who Binge Drink Zip Code: 29899
21.7%
(2021)
Compared to:
SC Zip Codes
The distribution is based on data from 421 South Carolina zip codes.
U.S. Zip Codes
The distribution is based on data from 31,435 U.S. zip codes.
McCormick, SC County Value
(12.3%)
The regional value is compared to the McCormick County value.
US Value
(15.5%)
The regional value is compared to the national value.
Adults who Binge Drink Census Tract: 45001950100
Adults who Binge Drink Census Tract: 45001950100
16.4%
(2021)
Compared to:
SC Census Tracts
The distribution is based on data from 1,089 South Carolina census tracts.
U.S. Census Tracts
The distribution is based on data from 68,167 U.S. census tracts.
Abbeville, SC County Value
(14.5%)
The regional value is compared to the Abbeville County value.
US Value
(15.5%)
The regional value is compared to the national value.
Adults who Binge Drink Census Tract: 45001950200
Adults who Binge Drink Census Tract: 45001950200
17.2%
(2021)
Compared to:
SC Census Tracts
The distribution is based on data from 1,089 South Carolina census tracts.
U.S. Census Tracts
The distribution is based on data from 68,167 U.S. census tracts.
Abbeville, SC County Value
(14.5%)
The regional value is compared to the Abbeville County value.
US Value
(15.5%)
The regional value is compared to the national value.
Adults who Binge Drink Census Tract: 45001950300
Adults who Binge Drink Census Tract: 45001950300
14.8%
(2021)
Compared to:
SC Census Tracts
The distribution is based on data from 1,089 South Carolina census tracts.
U.S. Census Tracts
The distribution is based on data from 68,167 U.S. census tracts.
Abbeville, SC County Value
(14.5%)
The regional value is compared to the Abbeville County value.
US Value
(15.5%)
The regional value is compared to the national value.
Adults who Binge Drink Census Tract: 45001950400
Adults who Binge Drink Census Tract: 45001950400
15.4%
(2021)
Compared to:
SC Census Tracts
The distribution is based on data from 1,089 South Carolina census tracts.
U.S. Census Tracts
The distribution is based on data from 68,167 U.S. census tracts.
Abbeville, SC County Value
(14.5%)
The regional value is compared to the Abbeville County value.
US Value
(15.5%)
The regional value is compared to the national value.
Adults who Binge Drink Census Tract: 45001950500
Adults who Binge Drink Census Tract: 45001950500
14.6%
(2021)
Compared to:
SC Census Tracts
The distribution is based on data from 1,089 South Carolina census tracts.
U.S. Census Tracts
The distribution is based on data from 68,167 U.S. census tracts.
Abbeville, SC County Value
(14.5%)
The regional value is compared to the Abbeville County value.
US Value
(15.5%)
The regional value is compared to the national value.
Adults who Binge Drink Census Tract: 45001950600
Adults who Binge Drink Census Tract: 45001950600
13.7%
(2021)
Compared to:
SC Census Tracts
The distribution is based on data from 1,089 South Carolina census tracts.
U.S. Census Tracts
The distribution is based on data from 68,167 U.S. census tracts.
Abbeville, SC County Value
(14.5%)
The regional value is compared to the Abbeville County value.
US Value
(15.5%)
The regional value is compared to the national value.
Adults who Binge Drink Census Tract: 45047970101
Adults who Binge Drink Census Tract: 45047970101
15.1%
(2021)
Compared to:
SC Census Tracts
The distribution is based on data from 1,089 South Carolina census tracts.
U.S. Census Tracts
The distribution is based on data from 68,167 U.S. census tracts.
Greenwood, SC County Value
(13.6%)
The regional value is compared to the Greenwood County value.
US Value
(15.5%)
The regional value is compared to the national value.
Adults who Binge Drink Census Tract: 45047970102
Adults who Binge Drink Census Tract: 45047970102
14.3%
(2021)
Compared to:
SC Census Tracts
The distribution is based on data from 1,089 South Carolina census tracts.
U.S. Census Tracts
The distribution is based on data from 68,167 U.S. census tracts.
Greenwood, SC County Value
(13.6%)
The regional value is compared to the Greenwood County value.
US Value
(15.5%)
The regional value is compared to the national value.
Adults who Binge Drink Census Tract: 45047970201
Adults who Binge Drink Census Tract: 45047970201
15.2%
(2021)
Compared to:
SC Census Tracts
The distribution is based on data from 1,089 South Carolina census tracts.
U.S. Census Tracts
The distribution is based on data from 68,167 U.S. census tracts.
Greenwood, SC County Value
(13.6%)
The regional value is compared to the Greenwood County value.
US Value
(15.5%)
The regional value is compared to the national value.
Adults who Binge Drink Census Tract: 45047970202
Adults who Binge Drink Census Tract: 45047970202
15.7%
(2021)
Compared to:
SC Census Tracts
The distribution is based on data from 1,089 South Carolina census tracts.
U.S. Census Tracts
The distribution is based on data from 68,167 U.S. census tracts.
Greenwood, SC County Value
(13.6%)
The regional value is compared to the Greenwood County value.
US Value
(15.5%)
The regional value is compared to the national value.
Adults who Binge Drink Census Tract: 45047970301
Adults who Binge Drink Census Tract: 45047970301
16.5%
(2021)
Compared to:
SC Census Tracts
The distribution is based on data from 1,089 South Carolina census tracts.
U.S. Census Tracts
The distribution is based on data from 68,167 U.S. census tracts.
Greenwood, SC County Value
(13.6%)
The regional value is compared to the Greenwood County value.
US Value
(15.5%)
The regional value is compared to the national value.
Adults who Binge Drink Census Tract: 45047970302
Adults who Binge Drink Census Tract: 45047970302
16.2%
(2021)
Compared to:
SC Census Tracts
The distribution is based on data from 1,089 South Carolina census tracts.
U.S. Census Tracts
The distribution is based on data from 68,167 U.S. census tracts.
Greenwood, SC County Value
(13.6%)
The regional value is compared to the Greenwood County value.
US Value
(15.5%)
The regional value is compared to the national value.
Adults who Binge Drink Census Tract: 45047970400
Adults who Binge Drink Census Tract: 45047970400
14.9%
(2021)
Compared to:
SC Census Tracts
The distribution is based on data from 1,089 South Carolina census tracts.
U.S. Census Tracts
The distribution is based on data from 68,167 U.S. census tracts.
Greenwood, SC County Value
(13.6%)
The regional value is compared to the Greenwood County value.
US Value
(15.5%)
The regional value is compared to the national value.
Adults who Binge Drink Census Tract: 45047970500
Adults who Binge Drink Census Tract: 45047970500
11.5%
(2021)
Compared to:
SC Census Tracts
The distribution is based on data from 1,089 South Carolina census tracts.
U.S. Census Tracts
The distribution is based on data from 68,167 U.S. census tracts.
Greenwood, SC County Value
(13.6%)
The regional value is compared to the Greenwood County value.
US Value
(15.5%)
The regional value is compared to the national value.
Adults who Binge Drink Census Tract: 45047970600
Adults who Binge Drink Census Tract: 45047970600
12.6%
(2021)
Compared to:
SC Census Tracts
The distribution is based on data from 1,089 South Carolina census tracts.
U.S. Census Tracts
The distribution is based on data from 68,167 U.S. census tracts.
Greenwood, SC County Value
(13.6%)
The regional value is compared to the Greenwood County value.
US Value
(15.5%)
The regional value is compared to the national value.
Adults who Binge Drink Census Tract: 45047970701
Adults who Binge Drink Census Tract: 45047970701
13.9%
(2021)
Compared to:
SC Census Tracts
The distribution is based on data from 1,089 South Carolina census tracts.
U.S. Census Tracts
The distribution is based on data from 68,167 U.S. census tracts.
Greenwood, SC County Value
(13.6%)
The regional value is compared to the Greenwood County value.
US Value
(15.5%)
The regional value is compared to the national value.
Adults who Binge Drink Census Tract: 45047970702
Adults who Binge Drink Census Tract: 45047970702
13.5%
(2021)
Compared to:
SC Census Tracts
The distribution is based on data from 1,089 South Carolina census tracts.
U.S. Census Tracts
The distribution is based on data from 68,167 U.S. census tracts.
Greenwood, SC County Value
(13.6%)
The regional value is compared to the Greenwood County value.
US Value
(15.5%)
The regional value is compared to the national value.
Adults who Binge Drink Census Tract: 45047970800
Adults who Binge Drink Census Tract: 45047970800
12.9%
(2021)
Compared to:
SC Census Tracts
The distribution is based on data from 1,089 South Carolina census tracts.
U.S. Census Tracts
The distribution is based on data from 68,167 U.S. census tracts.
Greenwood, SC County Value
(13.6%)
The regional value is compared to the Greenwood County value.
US Value
(15.5%)
The regional value is compared to the national value.
Adults who Binge Drink Census Tract: 45047970900
Adults who Binge Drink Census Tract: 45047970900
14.2%
(2021)
Compared to:
SC Census Tracts
The distribution is based on data from 1,089 South Carolina census tracts.
U.S. Census Tracts
The distribution is based on data from 68,167 U.S. census tracts.
Greenwood, SC County Value
(13.6%)
The regional value is compared to the Greenwood County value.
US Value
(15.5%)
The regional value is compared to the national value.
Adults who Binge Drink Census Tract: 45047971000
Adults who Binge Drink Census Tract: 45047971000
15.2%
(2021)
Compared to:
SC Census Tracts
The distribution is based on data from 1,089 South Carolina census tracts.
U.S. Census Tracts
The distribution is based on data from 68,167 U.S. census tracts.
Greenwood, SC County Value
(13.6%)
The regional value is compared to the Greenwood County value.
US Value
(15.5%)
The regional value is compared to the national value.
Adults who Binge Drink Census Tract: 45065920100
Adults who Binge Drink Census Tract: 45065920100
10.6%
(2021)
Compared to:
SC Census Tracts
The distribution is based on data from 1,089 South Carolina census tracts.
U.S. Census Tracts
The distribution is based on data from 68,167 U.S. census tracts.
McCormick, SC County Value
(12.3%)
The regional value is compared to the McCormick County value.
US Value
(15.5%)
The regional value is compared to the national value.
Adults who Binge Drink Census Tract: 45065920200
Adults who Binge Drink Census Tract: 45065920200
14.5%
(2021)
Compared to:
SC Census Tracts
The distribution is based on data from 1,089 South Carolina census tracts.
U.S. Census Tracts
The distribution is based on data from 68,167 U.S. census tracts.
McCormick, SC County Value
(12.3%)
The regional value is compared to the McCormick County value.
US Value
(15.5%)
The regional value is compared to the national value.
Adults who Binge Drink Census Tract: 45065920300
Adults who Binge Drink Census Tract: 45065920300
13.9%
(2021)
Compared to:
SC Census Tracts
The distribution is based on data from 1,089 South Carolina census tracts.
U.S. Census Tracts
The distribution is based on data from 68,167 U.S. census tracts.
McCormick, SC County Value
(12.3%)
The regional value is compared to the McCormick County value.
US Value
(15.5%)
The regional value is compared to the national value.
Adults who Binge Drink Census Tract: 45081960100
Adults who Binge Drink Census Tract: 45081960100
15.4%
(2021)
Compared to:
SC Census Tracts
The distribution is based on data from 1,089 South Carolina census tracts.
U.S. Census Tracts
The distribution is based on data from 68,167 U.S. census tracts.
Saluda, SC County Value
(14.3%)
The regional value is compared to the Saluda County value.
US Value
(15.5%)
The regional value is compared to the national value.
Adults who Binge Drink Census Tract: 45081960201
Adults who Binge Drink Census Tract: 45081960201
14.2%
(2021)
Compared to:
SC Census Tracts
The distribution is based on data from 1,089 South Carolina census tracts.
U.S. Census Tracts
The distribution is based on data from 68,167 U.S. census tracts.
Saluda, SC County Value
(14.3%)
The regional value is compared to the Saluda County value.
US Value
(15.5%)
The regional value is compared to the national value.
Adults who Binge Drink Census Tract: 45081960202
Adults who Binge Drink Census Tract: 45081960202
16.1%
(2021)
Compared to:
SC Census Tracts
The distribution is based on data from 1,089 South Carolina census tracts.
U.S. Census Tracts
The distribution is based on data from 68,167 U.S. census tracts.
Saluda, SC County Value
(14.3%)
The regional value is compared to the Saluda County value.
US Value
(15.5%)
The regional value is compared to the national value.
Adults who Binge Drink Census Tract: 45081960300
Adults who Binge Drink Census Tract: 45081960300
16.3%
(2021)
Compared to:
SC Census Tracts
The distribution is based on data from 1,089 South Carolina census tracts.
U.S. Census Tracts
The distribution is based on data from 68,167 U.S. census tracts.
Saluda, SC County Value
(14.3%)
The regional value is compared to the Saluda County value.
US Value
(15.5%)
The regional value is compared to the national value.
Adults who Binge Drink Census Tract: 45081960400
Adults who Binge Drink Census Tract: 45081960400
15.2%
(2021)
Compared to:
SC Census Tracts
The distribution is based on data from 1,089 South Carolina census tracts.
U.S. Census Tracts
The distribution is based on data from 68,167 U.S. census tracts.
Saluda, SC County Value
(14.3%)
The regional value is compared to the Saluda County value.
US Value
(15.5%)
The regional value is compared to the national value.
Adults who Drink Excessively County: Abbeville
Adults who Drink Excessively County: Abbeville
16.1%
(2021)
Compared to:
SC Counties
The distribution is based on data from 46 South Carolina counties.
U.S. Counties
The distribution is based on data from 3,141 U.S. counties and county equivalents.
SC Value
(18.1%)
The regional value is compared to the South Carolina State value.
US Value
(18.1%)
The regional value is compared to the national value.
Prior Value
(19.9%)
Prior Value compares a measured value with the previously measured value. Confidence intervals were taken into account in determining the direction of the comparison.
Trend
This comparison measures the indicator’s values over multiple time periods.<br>The Mann-Kendall Test for Statistical Significance is used to evaluate the trend<br>over 4 to 10 periods of measure, subject to data availability and comparability.
Adults who Drink Excessively County: Greenwood
Adults who Drink Excessively County: Greenwood
14.5%
(2021)
Compared to:
SC Counties
The distribution is based on data from 46 South Carolina counties.
U.S. Counties
The distribution is based on data from 3,141 U.S. counties and county equivalents.
SC Value
(18.1%)
The regional value is compared to the South Carolina State value.
US Value
(18.1%)
The regional value is compared to the national value.
Prior Value
(16.3%)
Prior Value compares a measured value with the previously measured value. Confidence intervals were taken into account in determining the direction of the comparison.
Trend
This comparison measures the indicator’s values over multiple time periods.<br>The Mann-Kendall Test for Statistical Significance is used to evaluate the trend<br>over 4 to 10 periods of measure, subject to data availability and comparability.
Adults who Drink Excessively County: McCormick
Adults who Drink Excessively County: McCormick
13.7%
(2021)
Compared to:
SC Counties
The distribution is based on data from 46 South Carolina counties.
U.S. Counties
The distribution is based on data from 3,141 U.S. counties and county equivalents.
SC Value
(18.1%)
The regional value is compared to the South Carolina State value.
US Value
(18.1%)
The regional value is compared to the national value.
Prior Value
(18.2%)
Prior Value compares a measured value with the previously measured value. Confidence intervals were taken into account in determining the direction of the comparison.
Trend
This comparison measures the indicator’s values over multiple time periods.<br>The Mann-Kendall Test for Statistical Significance is used to evaluate the trend<br>over 4 to 10 periods of measure, subject to data availability and comparability.
Adults who Drink Excessively County: Saluda
Adults who Drink Excessively County: Saluda
15.7%
(2021)
Compared to:
SC Counties
The distribution is based on data from 46 South Carolina counties.
U.S. Counties
The distribution is based on data from 3,141 U.S. counties and county equivalents.
SC Value
(18.1%)
The regional value is compared to the South Carolina State value.
US Value
(18.1%)
The regional value is compared to the national value.
Prior Value
(18.0%)
Prior Value compares a measured value with the previously measured value. Confidence intervals were taken into account in determining the direction of the comparison.
Trend
This comparison measures the indicator’s values over multiple time periods.<br>The Mann-Kendall Test for Statistical Significance is used to evaluate the trend<br>over 4 to 10 periods of measure, subject to data availability and comparability.
Health / Alcohol & Drug Use
Age-Adjusted Drug and Opioid-Involved Overdose Death Rate
Value
Compared to:
Age-Adjusted Drug and Opioid-Involved Overdose Death Rate County: Greenwood
Age-Adjusted Drug and Opioid-Involved Overdose Death Rate County: Greenwood
29.4
Deaths per 100,000 population
(2018-2020)
Compared to:
SC Counties
The distribution is based on data from 30 South Carolina counties.
U.S. Counties
The distribution is based on data from 1,303 U.S. counties and county equivalents.
SC Value
(26.8)
The regional value is compared to the South Carolina State value.
US Value
(23.5)
The regional value is compared to the national value.
Prior Value
(24.1)
Prior Value compares a measured value with the previously measured value. Confidence intervals were taken into account in determining the direction of the comparison.
Health / Alcohol & Drug Use
Age-Adjusted Hospitalization Rate due to Alcohol Abuse
Value
Compared to:
Age-Adjusted Hospitalization Rate due to Alcohol Abuse County: Abbeville
Age-Adjusted Hospitalization Rate due to Alcohol Abuse County: Abbeville
64.0
Hospitalizations per 100,000 population 18+
(2017-2019)
Compared to:
SC Counties
The distribution is based on data from 46 South Carolina counties.
Prior Value
(70.0)
Prior Value compares a measured value with the previously measured value. Confidence intervals were not taken into account in determining the direction of the comparison.
Age-Adjusted Hospitalization Rate due to Alcohol Abuse County: Greenwood
Age-Adjusted Hospitalization Rate due to Alcohol Abuse County: Greenwood
88.0
Hospitalizations per 100,000 population 18+
(2017-2019)
Compared to:
SC Counties
The distribution is based on data from 46 South Carolina counties.
Prior Value
(93.0)
Prior Value compares a measured value with the previously measured value. Confidence intervals were not taken into account in determining the direction of the comparison.
Age-Adjusted Hospitalization Rate due to Alcohol Abuse County: McCormick
Age-Adjusted Hospitalization Rate due to Alcohol Abuse County: McCormick
0.0
Hospitalizations per 100,000 population 18+
(2017-2019)
Compared to:
SC Counties
The distribution is based on data from 46 South Carolina counties.
Prior Value
(0.0)
Prior Value compares a measured value with the previously measured value. Confidence intervals were not taken into account in determining the direction of the comparison.
Age-Adjusted Hospitalization Rate due to Alcohol Abuse County: Saluda
Age-Adjusted Hospitalization Rate due to Alcohol Abuse County: Saluda
41.0
Hospitalizations per 100,000 population 18+
(2017-2019)
Compared to:

SC Counties
The distribution is based on data from 46 South Carolina counties.
Prior Value
(40.0)
Prior Value compares a measured value with the previously measured value. Confidence intervals were not taken into account in determining the direction of the comparison.
Age-Adjusted Hospitalization Rate due to Alcohol Abuse Zip Code: 29138
Age-Adjusted Hospitalization Rate due to Alcohol Abuse Zip Code: 29138
77.0
Hospitalizations per 100,000 population 18+
(2017-2019)
Compared to:
Prior Value
(73.0)
Prior Value compares a measured value with the previously measured value. Confidence intervals were not taken into account in determining the direction of the comparison.
Age-Adjusted Hospitalization Rate due to Alcohol Abuse Zip Code: 29620
Age-Adjusted Hospitalization Rate due to Alcohol Abuse Zip Code: 29620
78.0
Hospitalizations per 100,000 population 18+
(2017-2019)
Compared to:
Prior Value
(98.0)
Prior Value compares a measured value with the previously measured value. Confidence intervals were not taken into account in determining the direction of the comparison.
Age-Adjusted Hospitalization Rate due to Alcohol Abuse Zip Code: 29646
Age-Adjusted Hospitalization Rate due to Alcohol Abuse Zip Code: 29646
124.0
Hospitalizations per 100,000 population 18+
(2017-2019)
Compared to:
Prior Value
(153.0)
Prior Value compares a measured value with the previously measured value. Confidence intervals were not taken into account in determining the direction of the comparison.
Age-Adjusted Hospitalization Rate due to Alcohol Abuse Zip Code: 29649
Age-Adjusted Hospitalization Rate due to Alcohol Abuse Zip Code: 29649
62.0
Hospitalizations per 100,000 population 18+
(2017-2019)
Compared to:
Prior Value
(43.0)
Prior Value compares a measured value with the previously measured value. Confidence intervals were not taken into account in determining the direction of the comparison.
Age-Adjusted Hospitalization rate due to Opioid Use County: Abbeville
Age-Adjusted Hospitalization rate due to Opioid Use County: Abbeville
210.0
Hospitalizations per 100,000 population 18+
(2017-2019)
Compared to:
SC Counties
The distribution is based on data from 46 South Carolina counties.
Prior Value
(181.0)
Prior Value compares a measured value with the previously measured value. Confidence intervals were not taken into account in determining the direction of the comparison.
Age-Adjusted Hospitalization rate due to Opioid Use County: Greenwood
Age-Adjusted Hospitalization rate due to Opioid Use County: Greenwood
556.0
Hospitalizations per 100,000 population 18+
(2017-2019)
Compared to:
SC Counties
The distribution is based on data from 46 South Carolina counties.
Prior Value
(477.0)
Prior Value compares a measured value with the previously measured value. Confidence intervals were not taken into account in determining the direction of the comparison.
Age-Adjusted Hospitalization rate due to Opioid Use County: McCormick
Age-Adjusted Hospitalization rate due to Opioid Use County: McCormick
88.0
Hospitalizations per 100,000 population 18+
(2017-2019)
Compared to:
SC Counties
The distribution is based on data from 46 South Carolina counties.
Prior Value
(57.0)
Prior Value compares a measured value with the previously measured value. Confidence intervals were not taken into account in determining the direction of the comparison.
Age-Adjusted Hospitalization rate due to Opioid Use County: Saluda
Age-Adjusted Hospitalization rate due to Opioid Use County: Saluda
89.0
Hospitalizations per 100,000 population 18+
(2017-2019)
Compared to:
SC Counties
The distribution is based on data from 46 South Carolina counties.
Prior Value
(100.0)
Prior Value compares a measured value with the previously measured value. Confidence intervals were not taken into account in determining the direction of the comparison.
Age-Adjusted Hospitalization rate due to Opioid Use Zip Code: 29138
Age-Adjusted Hospitalization rate due to Opioid Use Zip Code: 29138
117.0
Hospitalizations per 100,000 population 18+
(2017-2019)
Compared to:
SC Zip Codes
The distribution is based on data from 308 South Carolina zip codes.
Prior Value
(122.0)
Prior Value compares a measured value with the previously measured value. Confidence intervals were not taken into account in determining the direction of the comparison.
Age-Adjusted Hospitalization rate due to Opioid Use Zip Code: 29620
Age-Adjusted Hospitalization rate due to Opioid Use Zip Code: 29620
295.0
Hospitalizations per 100,000 population 18+
(2017-2019)
Compared to:
SC Zip Codes
The distribution is based on data from 308 South Carolina zip codes.
Prior Value
(247.0)
Prior Value compares a measured value with the previously measured value. Confidence intervals were not taken into account in determining the direction of the comparison.
Age-Adjusted Hospitalization rate due to Opioid Use Zip Code: 29638
Age-Adjusted Hospitalization rate due to Opioid Use Zip Code: 29638
258.0
Hospitalizations per 100,000 population 18+
(2017-2019)
Compared to:
SC Zip Codes
The distribution is based on data from 308 South Carolina zip codes.
Prior Value
(286.0)
Prior Value compares a measured value with the previously measured value. Confidence intervals were not taken into account in determining the direction of the comparison.
Age-Adjusted Hospitalization rate due to Opioid Use Zip Code: 29646
Age-Adjusted Hospitalization rate due to Opioid Use Zip Code: 29646
711.0
Hospitalizations per 100,000 population 18+
(2017-2019)
Compared to:
SC Zip Codes
The distribution is based on data from 308 South Carolina zip codes.
Prior Value
(654.0)
Prior Value compares a measured value with the previously measured value. Confidence intervals were not taken into account in determining the direction of the comparison.
Age-Adjusted Hospitalization rate due to Opioid Use Zip Code: 29649
Age-Adjusted Hospitalization rate due to Opioid Use Zip Code: 29649
408.0
Hospitalizations per 100,000 population 18+
(2017-2019)
Compared to:
SC Zip Codes
The distribution is based on data from 308 South Carolina zip codes.
Prior Value
(337.0)
Prior Value compares a measured value with the previously measured value. Confidence intervals were not taken into account in determining the direction of the comparison.
Age-Adjusted Hospitalization rate due to Opioid Use Zip Code: 29653
Age-Adjusted Hospitalization rate due to Opioid Use Zip Code: 29653
592.0
Hospitalizations per 100,000 population 18+
(2017-2019)
Compared to:
SC Zip Codes
The distribution is based on data from 308 South Carolina zip codes.
Prior Value
(343.0)
Prior Value compares a measured value with the previously measured value. Confidence intervals were not taken into account in determining the direction of the comparison.
Age-Adjusted Hospitalization rate due to Opioid Use Zip Code: 29666
Age-Adjusted Hospitalization rate due to Opioid Use Zip Code: 29666
569.0
Hospitalizations per 100,000 population 18+
(2017-2019)
Compared to:
SC Zip Codes
The distribution is based on data from 308 South Carolina zip codes.
Prior Value
(535.0)
Prior Value compares a measured value with the previously measured value. Confidence intervals were not taken into account in determining the direction of the comparison.
Age-Adjusted Hospitalization rate due to Opioid Use Zip Code: 29819
Age-Adjusted Hospitalization rate due to Opioid Use Zip Code: 29819
776.0
Hospitalizations per 100,000 population 18+
(2017-2019)
Compared to:
SC Zip Codes
The distribution is based on data from 308 South Carolina zip codes.
Prior Value
(657.0)
Prior Value compares a measured value with the previously measured value. Confidence intervals were not taken into account in determining the direction of the comparison.
Health / Alcohol & Drug Use
Age-Adjusted Hospitalization Rate due to Substance Disorders
Value
Compared to:
Age-Adjusted Hospitalization Rate due to Substance Disorders County: Abbeville
Age-Adjusted Hospitalization Rate due to Substance Disorders County: Abbeville
708.0
Hospitalizations per 100,000 population 18+
(2017-2019)
Compared to:
SC Counties
The distribution is based on data from 46 South Carolina counties.
Prior Value
(672.0)
Prior Value compares a measured value with the previously measured value. Confidence intervals were not taken into account in determining the direction of the comparison.
Age-Adjusted Hospitalization Rate due to Substance Disorders County: Greenwood
Age-Adjusted Hospitalization Rate due to Substance Disorders County: Greenwood
1,391.0
Hospitalizations per 100,000 population 18+
(2017-2019)
Compared to:
SC Counties
The distribution is based on data from 46 South Carolina counties.
Prior Value
(1,223.0)
Prior Value compares a measured value with the previously measured value. Confidence intervals were not taken into account in determining the direction of the comparison.
Age-Adjusted Hospitalization Rate due to Substance Disorders County: McCormick
Age-Adjusted Hospitalization Rate due to Substance Disorders County: McCormick
321.0
Hospitalizations per 100,000 population 18+
(2017-2019)
Compared to:

SC Counties
The distribution is based on data from 46 South Carolina counties.
Prior Value
(344.0)
Prior Value compares a measured value with the previously measured value. Confidence intervals were not taken into account in determining the direction of the comparison.
Age-Adjusted Hospitalization Rate due to Substance Disorders County: Saluda
Age-Adjusted Hospitalization Rate due to Substance Disorders County: Saluda
418.0
Hospitalizations per 100,000 population 18+
(2017-2019)
Compared to:
SC Counties
The distribution is based on data from 46 South Carolina counties.
Prior Value
(421.0)
Prior Value compares a measured value with the previously measured value. Confidence intervals were not taken into account in determining the direction of the comparison.
Age-Adjusted Hospitalization Rate due to Substance Disorders Zip Code: 29129
Age-Adjusted Hospitalization Rate due to Substance Disorders Zip Code: 29129
736.0
Hospitalizations per 100,000 population 18+
(2017-2019)
Compared to:
SC Zip Codes
The distribution is based on data from 360 South Carolina zip codes.
Prior Value
(772.0)
Prior Value compares a measured value with the previously measured value. Confidence intervals were not taken into account in determining the direction of the comparison.
Age-Adjusted Hospitalization Rate due to Substance Disorders Zip Code: 29138
Age-Adjusted Hospitalization Rate due to Substance Disorders Zip Code: 29138
436.0
Hospitalizations per 100,000 population 18+
(2017-2019)
Compared to:
SC Zip Codes
The distribution is based on data from 360 South Carolina zip codes.
Prior Value
(447.0)
Prior Value compares a measured value with the previously measured value. Confidence intervals were not taken into account in determining the direction of the comparison.
Age-Adjusted Hospitalization Rate due to Substance Disorders Zip Code: 29166
Age-Adjusted Hospitalization Rate due to Substance Disorders Zip Code: 29166
2,550.0
Hospitalizations per 100,000 population 18+
(2017-2019)
Compared to:
SC Zip Codes
The distribution is based on data from 360 South Carolina zip codes.
Age-Adjusted Hospitalization Rate due to Substance Disorders Zip Code: 29620
Age-Adjusted Hospitalization Rate due to Substance Disorders Zip Code: 29620
887.0
Hospitalizations per 100,000 population 18+
(2017-2019)
Compared to:
SC Zip Codes
The distribution is based on data from 360 South Carolina zip codes.
Prior Value
(802.0)
Prior Value compares a measured value with the previously measured value. Confidence intervals were not taken into account in determining the direction of the comparison.
Age-Adjusted Hospitalization Rate due to Substance Disorders Zip Code: 29628
Age-Adjusted Hospitalization Rate due to Substance Disorders Zip Code: 29628
871.0
Hospitalizations per 100,000 population 18+
(2017-2019)
Compared to:
SC Zip Codes
The distribution is based on data from 360 South Carolina zip codes.
Prior Value
(910.0)
Prior Value compares a measured value with the previously measured value. Confidence intervals were not taken into account in determining the direction of the comparison.
Age-Adjusted Hospitalization Rate due to Substance Disorders Zip Code: 29638
Age-Adjusted Hospitalization Rate due to Substance Disorders Zip Code: 29638
780.0
Hospitalizations per 100,000 population 18+
(2017-2019)
Compared to:
SC Zip Codes
The distribution is based on data from 360 South Carolina zip codes.
Prior Value
(815.0)
Prior Value compares a measured value with the previously measured value. Confidence intervals were not taken into account in determining the direction of the comparison.
Age-Adjusted Hospitalization Rate due to Substance Disorders Zip Code: 29639
Age-Adjusted Hospitalization Rate due to Substance Disorders Zip Code: 29639
674.0
Hospitalizations per 100,000 population 18+
(2017-2019)
Compared to:
SC Zip Codes
The distribution is based on data from 360 South Carolina zip codes.
Prior Value
(532.0)
Prior Value compares a measured value with the previously measured value. Confidence intervals were not taken into account in determining the direction of the comparison.
Age-Adjusted Hospitalization Rate due to Substance Disorders Zip Code: 29646
Age-Adjusted Hospitalization Rate due to Substance Disorders Zip Code: 29646
1,787.0
Hospitalizations per 100,000 population 18+
(2017-2019)
Compared to:
SC Zip Codes
The distribution is based on data from 360 South Carolina zip codes.
Prior Value
(1,668.0)
Prior Value compares a measured value with the previously measured value. Confidence intervals were not taken into account in determining the direction of the comparison.
Age-Adjusted Hospitalization Rate due to Substance Disorders Zip Code: 29649
Age-Adjusted Hospitalization Rate due to Substance Disorders Zip Code: 29649
928.0
Hospitalizations per 100,000 population 18+
(2017-2019)
Compared to:
SC Zip Codes
The distribution is based on data from 360 South Carolina zip codes.
Prior Value
(773.0)
Prior Value compares a measured value with the previously measured value. Confidence intervals were not taken into account in determining the direction of the comparison.
Age-Adjusted Hospitalization Rate due to Substance Disorders Zip Code: 29653
Age-Adjusted Hospitalization Rate due to Substance Disorders Zip Code: 29653
1,720.0
Hospitalizations per 100,000 population 18+
(2017-2019)
Compared to:
SC Zip Codes
The distribution is based on data from 360 South Carolina zip codes.
Prior Value
(922.0)
Prior Value compares a measured value with the previously measured value. Confidence intervals were not taken into account in determining the direction of the comparison.
Age-Adjusted Hospitalization Rate due to Substance Disorders Zip Code: 29666
Age-Adjusted Hospitalization Rate due to Substance Disorders Zip Code: 29666
1,025.0
Hospitalizations per 100,000 population 18+
(2017-2019)
Compared to:
SC Zip Codes
The distribution is based on data from 360 South Carolina zip codes.
Prior Value
(993.0)
Prior Value compares a measured value with the previously measured value. Confidence intervals were not taken into account in determining the direction of the comparison.
Age-Adjusted Hospitalization Rate due to Substance Disorders Zip Code: 29819
Age-Adjusted Hospitalization Rate due to Substance Disorders Zip Code: 29819
1,401.0
Hospitalizations per 100,000 population 18+
(2017-2019)
Compared to:
SC Zip Codes
The distribution is based on data from 360 South Carolina zip codes.
Prior Value
(1,345.0)
Prior Value compares a measured value with the previously measured value. Confidence intervals were not taken into account in determining the direction of the comparison.
Age-Adjusted Hospitalization Rate due to Substance Disorders Zip Code: 29835
Age-Adjusted Hospitalization Rate due to Substance Disorders Zip Code: 29835
418.0
Hospitalizations per 100,000 population 18+
(2017-2019)
Compared to:
SC Zip Codes
The distribution is based on data from 360 South Carolina zip codes.
Prior Value
(474.0)
Prior Value compares a measured value with the previously measured value. Confidence intervals were not taken into account in determining the direction of the comparison.
Alcohol-Impaired Driving Deaths County: Abbeville
Alcohol-Impaired Driving Deaths County: Abbeville
50.0%
Percent of driving deaths with alcohol involvement
(2017-2021)
Compared to:
SC Counties
The distribution is based on data from 46 South Carolina counties.
U.S. Counties
The distribution is based on data from 3,116 U.S. counties and county equivalents.
SC Value
(32.6%)
The regional value is compared to the South Carolina State value.
US Value
(26.3%)
The regional value is compared to the national value.
Prior Value
(38.1%)
Prior Value compares a measured value with the previously measured value. Confidence intervals were taken into account in determining the direction of the comparison.
Trend
This comparison measures the indicator’s values over multiple time periods.<br>The Mann-Kendall Test for Statistical Significance is used to evaluate the trend<br>over 4 to 10 periods of measure, subject to data availability and comparability.
Alcohol-Impaired Driving Deaths County: Greenwood
Alcohol-Impaired Driving Deaths County: Greenwood
32.8%
Percent of driving deaths with alcohol involvement
(2017-2021)
Compared to:
SC Counties
The distribution is based on data from 46 South Carolina counties.
U.S. Counties
The distribution is based on data from 3,116 U.S. counties and county equivalents.
SC Value
(32.6%)
The regional value is compared to the South Carolina State value.
US Value
(26.3%)
The regional value is compared to the national value.
Prior Value
(29.4%)
Prior Value compares a measured value with the previously measured value. Confidence intervals were taken into account in determining the direction of the comparison.
Trend
This comparison measures the indicator’s values over multiple time periods.<br>The Mann-Kendall Test for Statistical Significance is used to evaluate the trend<br>over 4 to 10 periods of measure, subject to data availability and comparability.
Alcohol-Impaired Driving Deaths County: McCormick
Alcohol-Impaired Driving Deaths County: McCormick
25.0%
Percent of driving deaths with alcohol involvement
(2017-2021)
Compared to:
SC Counties
The distribution is based on data from 46 South Carolina counties.
U.S. Counties
The distribution is based on data from 3,116 U.S. counties and county equivalents.
SC Value
(32.6%)
The regional value is compared to the South Carolina State value.
US Value
(26.3%)
The regional value is compared to the national value.
Prior Value
(25.0%)
Prior Value compares a measured value with the previously measured value. Confidence intervals were taken into account in determining the direction of the comparison.
Trend
This comparison measures the indicator’s values over multiple time periods.<br>The Mann-Kendall Test for Statistical Significance is used to evaluate the trend<br>over 4 to 10 periods of measure, subject to data availability and comparability.
Alcohol-Impaired Driving Deaths County: Saluda
Alcohol-Impaired Driving Deaths County: Saluda
32.0%
Percent of driving deaths with alcohol involvement
(2017-2021)
Compared to:

SC Counties
The distribution is based on data from 46 South Carolina counties.
U.S. Counties
The distribution is based on data from 3,116 U.S. counties and county equivalents.
SC Value
(32.6%)
The regional value is compared to the South Carolina State value.
US Value
(26.3%)
The regional value is compared to the national value.
Prior Value
(36.8%)
Prior Value compares a measured value with the previously measured value. Confidence intervals were taken into account in determining the direction of the comparison.
Trend
This comparison measures the indicator’s values over multiple time periods.<br>The Mann-Kendall Test for Statistical Significance is used to evaluate the trend<br>over 4 to 10 periods of measure, subject to data availability and comparability.
Death Rate due to Drug Poisoning County: Abbeville
Death Rate due to Drug Poisoning County: Abbeville
25.9
Deaths per 100,000 population
(2019-2021)
Compared to:
SC Counties
The distribution is based on data from 41 South Carolina counties.
U.S. Counties
The distribution is based on data from 1,899 U.S. counties and county equivalents.
SC Value
(32.2)
The regional value is compared to the South Carolina State value.
US Value
(27.2)
The regional value is compared to the national value.
HP 2030 Target
(20.7)
<div>SU-03: Reduce drug overdose deaths <strong>(LEADING HEALTH INDICATOR)</strong></div>
Death Rate due to Drug Poisoning County: Greenwood
Death Rate due to Drug Poisoning County: Greenwood
37.9
Deaths per 100,000 population
(2019-2021)
Compared to:
SC Counties
The distribution is based on data from 41 South Carolina counties.
U.S. Counties
The distribution is based on data from 1,899 U.S. counties and county equivalents.
SC Value
(32.2)
The regional value is compared to the South Carolina State value.
US Value
(27.2)
The regional value is compared to the national value.
HP 2030 Target
(20.7)
<div>SU-03: Reduce drug overdose deaths <strong>(LEADING HEALTH INDICATOR)</strong></div>
Driving Under the Influence Arrest County: Greenwood
Driving Under the Influence Arrest County: Greenwood
348
Arrest
(2021)
Compared to:
Prior Value
(343)
Prior Value compares a measured value with the previously measured value. Confidence intervals were not taken into account in determining the direction of the comparison.
Trend
This comparison measures the indicator’s values over multiple time periods.<br>The Mann-Kendall Test for Statistical Significance is used to evaluate the trend<br>over 4 to 10 periods of measure, subject to data availability and comparability.
Drug Law Violations Arrest County: Greenwood
Drug Law Violations Arrest County: Greenwood
1,052
Arrest
(2020)
Compared to:
Prior Value
(831)
Prior Value compares a measured value with the previously measured value. Confidence intervals were not taken into account in determining the direction of the comparison.
Trend
This comparison measures the indicator’s values over multiple time periods.<br>The Mann-Kendall Test for Statistical Significance is used to evaluate the trend<br>over 4 to 10 periods of measure, subject to data availability and comparability.
Drunkenness Arrest County: Greenwood
Drunkenness Arrest County: Greenwood
126
Arrest
(2020)
Compared to:
Prior Value
(220)
Prior Value compares a measured value with the previously measured value. Confidence intervals were not taken into account in determining the direction of the comparison.
Trend
This comparison measures the indicator’s values over multiple time periods.<br>The Mann-Kendall Test for Statistical Significance is used to evaluate the trend<br>over 4 to 10 periods of measure, subject to data availability and comparability.
Health Behaviors Ranking County: Abbeville
Health Behaviors Ranking County: Abbeville
24
(2023)
Compared to:
SC Counties
The distribution is based on data from 46 South Carolina counties.
Health Behaviors Ranking County: Greenwood
Health Behaviors Ranking County: Greenwood
19
(2023)
Compared to:
SC Counties
The distribution is based on data from 46 South Carolina counties.
Health Behaviors Ranking County: McCormick
Health Behaviors Ranking County: McCormick
17
(2023)
Compared to:
SC Counties
The distribution is based on data from 46 South Carolina counties.
Health Behaviors Ranking County: Saluda
Health Behaviors Ranking County: Saluda
25
(2023)
Compared to:
SC Counties
The distribution is based on data from 46 South Carolina counties.
Liquor Store Density County: Abbeville
Liquor Store Density County: Abbeville
12.2
Stores per 100,000 population
(2017)
Compared to:

SC Counties
The distribution is based on data from 28 South Carolina counties.
U.S. Counties
The distribution is based on data from 1,475 U.S. counties and county equivalents.
SC Value
(9.0)
The regional value is compared to the South Carolina State value.
US Value
(10.6)
The regional value is compared to the national value.
Prior Value
(12.1)
Prior Value compares a measured value with the previously measured value. Confidence intervals were not taken into account in determining the direction of the comparison.
Trend
This comparison measures the indicator’s values over multiple time periods.<br>The Mann-Kendall Test for Statistical Significance is used to evaluate the trend<br>over 4 to 10 periods of measure, subject to data availability and comparability.
Liquor Store Density County: Greenwood
Liquor Store Density County: Greenwood
13.0
Stores per 100,000 population
(2021)
Compared to:
SC Counties
The distribution is based on data from 27 South Carolina counties.
U.S. Counties
The distribution is based on data from 1,477 U.S. counties and county equivalents.
SC Value
(10.2)
The regional value is compared to the South Carolina State value.
US Value
(10.7)
The regional value is compared to the national value.
Prior Value
(10.1)
Prior Value compares a measured value with the previously measured value. Confidence intervals were not taken into account in determining the direction of the comparison.
Trend
This comparison measures the indicator’s values over multiple time periods.<br>The Mann-Kendall Test for Statistical Significance is used to evaluate the trend<br>over 4 to 10 periods of measure, subject to data availability and comparability.
Liquor Store Density County: McCormick
Liquor Store Density County: McCormick
20.7
Stores per 100,000 population
(2016)
Compared to:
SC Counties
The distribution is based on data from 44 South Carolina counties.
U.S. Counties
The distribution is based on data from 2,451 U.S. counties and county equivalents.
SC Value
(8.6)
The regional value is compared to the South Carolina State value.
US Value
(10.5)
The regional value is compared to the national value.
Prior Value
(10.3)
Prior Value compares a measured value with the previously measured value. Confidence intervals were not taken into account in determining the direction of the comparison.
Liquor Store Density County: Saluda
Liquor Store Density County: Saluda
5.0
Stores per 100,000 population
(2016)
Compared to:
SC Counties
The distribution is based on data from 44 South Carolina counties.
U.S. Counties
The distribution is based on data from 2,451 U.S. counties and county equivalents.
SC Value
(8.6)
The regional value is compared to the South Carolina State value.
US Value
(10.5)
The regional value is compared to the national value.
Prior Value
(5.0)
Prior Value compares a measured value with the previously measured value. Confidence intervals were not taken into account in determining the direction of the comparison.
Mothers who Smoked During Pregnancy County: Abbeville
Mothers who Smoked During Pregnancy County: Abbeville
10.9%
(2020)
Compared to:
SC Counties
The distribution is based on data from 46 South Carolina counties.
SC Value
(6.5%)
The regional value is compared to the South Carolina State value.
US Value
(5.5%)
The regional value is compared to the national value. The source for the national value is Centers for Disease Control and Prevention
Prior Value
(13.1%)
Prior Value compares a measured value with the previously measured value. Confidence intervals were not taken into account in determining the direction of the comparison.
Trend
This comparison measures the indicator’s values over multiple time periods.<br>The Mann-Kendall Test for Statistical Significance is used to evaluate the trend<br>over 4 to 10 periods of measure, subject to data availability and comparability.
HP 2030 Target
(4.3%)
Mothers who Smoked During Pregnancy County: Greenwood
Mothers who Smoked During Pregnancy County: Greenwood
8.5%
(2020)
Compared to:
SC Counties
The distribution is based on data from 46 South Carolina counties.
SC Value
(6.5%)
The regional value is compared to the South Carolina State value.
US Value
(5.5%)
The regional value is compared to the national value. The source for the national value is Centers for Disease Control and Prevention
Prior Value
(11.8%)
Prior Value compares a measured value with the previously measured value. Confidence intervals were not taken into account in determining the direction of the comparison.
Trend
This comparison measures the indicator’s values over multiple time periods.<br>The Mann-Kendall Test for Statistical Significance is used to evaluate the trend<br>over 4 to 10 periods of measure, subject to data availability and comparability.
HP 2030 Target
(4.3%)
Mothers who Smoked During Pregnancy County: McCormick
Mothers who Smoked During Pregnancy County: McCormick
6.1%
(2020)
Compared to:
SC Counties
The distribution is based on data from 46 South Carolina counties.
SC Value
(6.5%)
The regional value is compared to the South Carolina State value.
US Value
(5.5%)
The regional value is compared to the national value. The source for the national value is Centers for Disease Control and Prevention
Prior Value
(2.0%)
Prior Value compares a measured value with the previously measured value. Confidence intervals were not taken into account in determining the direction of the comparison.
Trend
This comparison measures the indicator’s values over multiple time periods.<br>The Mann-Kendall Test for Statistical Significance is used to evaluate the trend<br>over 4 to 10 periods of measure, subject to data availability and comparability.
HP 2030 Target
(4.3%)
Mothers who Smoked During Pregnancy County: Saluda
Mothers who Smoked During Pregnancy County: Saluda
4.9%
(2020)
Compared to:
SC Counties
The distribution is based on data from 46 South Carolina counties.
SC Value
(6.5%)
The regional value is compared to the South Carolina State value.
US Value
(5.5%)
The regional value is compared to the national value. The source for the national value is Centers for Disease Control and Prevention
Prior Value
(3.9%)
Prior Value compares a measured value with the previously measured value. Confidence intervals were not taken into account in determining the direction of the comparison.
Trend
This comparison measures the indicator’s values over multiple time periods.<br>The Mann-Kendall Test for Statistical Significance is used to evaluate the trend<br>over 4 to 10 periods of measure, subject to data availability and comparability.
HP 2030 Target
(4.3%)
